

History and news
AI war map animation maker: describe it, then check every date and border
A war map animation shows how a conflict moved: territory changing hands, front lines advancing, arrows for attacks and dates on screen. With Maptake’s AI agent you describe the conflict; it plans the video, picks a look, places the territory and labels and sets the camera shots. You then check and fine-tune each layer on the timeline.
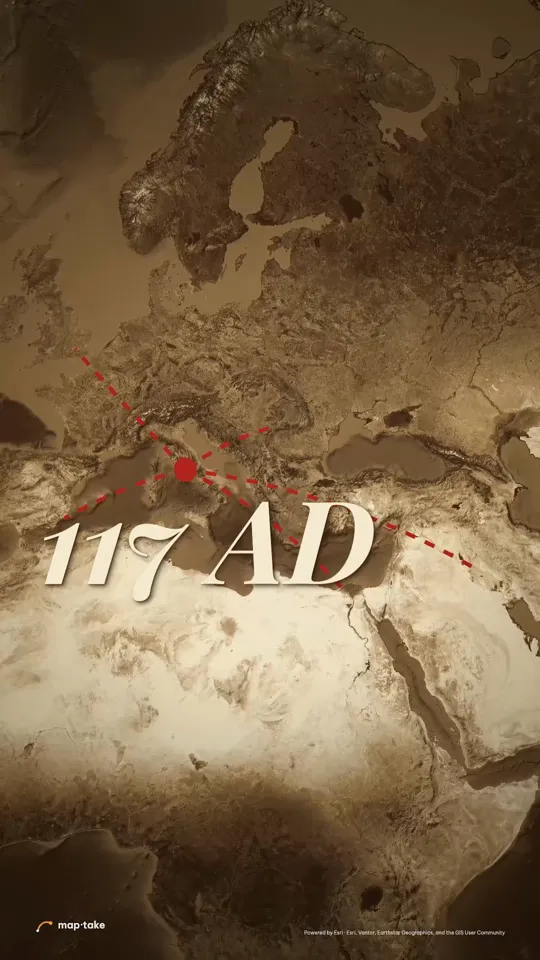
Watch how “How far Rome reached” was built
How do I make a war map animation with AI?
Describe the conflict or the period, the length and the mood. The agent plans the video and builds it on the timeline, and you check every date and border before you export.
This is the request this example was planned from:
“How far did the Roman Empire actually reach? 30 seconds, epic. Hook me.”
It is a history map, not a battle map, but the pattern carries over: lines leave a centre, the camera pulls back, and a date lands. The plan set the feeling (“one city did all that”) and the wow moment (14 to 20 s) before any layer existed.
The agent works in this order, the same as in the app’s chat:
- Plan. It writes the story, the feeling and the camera shots. Here: lines march out one at a time, the map opens, then the lines retract under “it could not hold”.
- Places and data. It finds Rome and the provinces the story names (Hispania, Britannia, Dacia, Aegyptus) and the lines between them.
- Look. It picks one design system: an old relief atlas with red ink lines.
- Scenes, one by one. It builds each scene on the timeline: the lines, the place tags, the year and the camera shots.
- Review. It checks frames of the result against the plan and corrects what does not match.
- Done. You get an ordinary project. This one has 11 camera shots, 9 labels and 5 lines.
Then you check and edit by hand:
- Check each date, name and border against your sources, and retype what is wrong.
- Replace built-in borders with a dated GeoJSON when the period needs it.
- Retime the camera or the lines so the date has room to land.
This example was planned by one AI model and built by another with the editor’s own tools, not by the agent inside the app. The in-app agent works with the same tools.
Which examples are close to a war map?
The hero video is Rome in 117 AD: red lines march out of Rome across an old atlas, then pull back toward the city under the words “it could not hold”. These three show other looks.
-
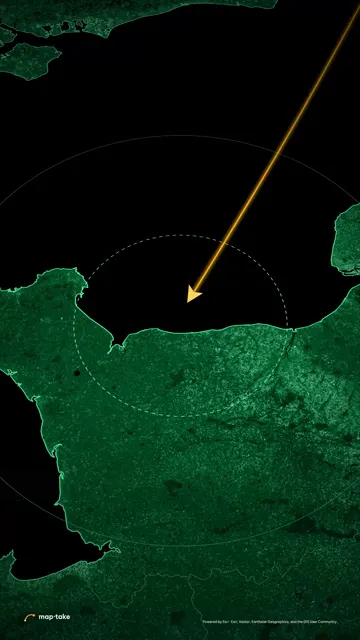 Phosphor War rooms · 9:16 · 5 s War-room look: a green phosphor screen and the Normandy coast.
-
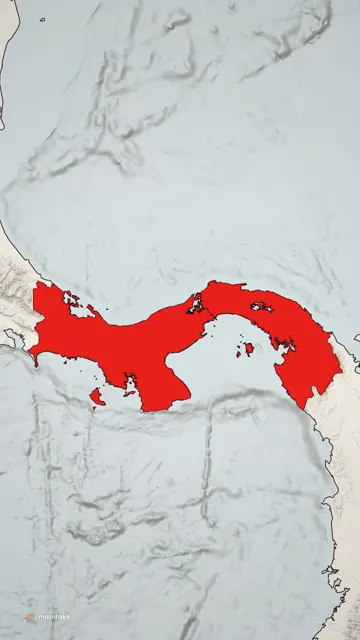 Front Page News · 9:16 · 5 s News look: warm newsprint paper and one place in solid red.
-
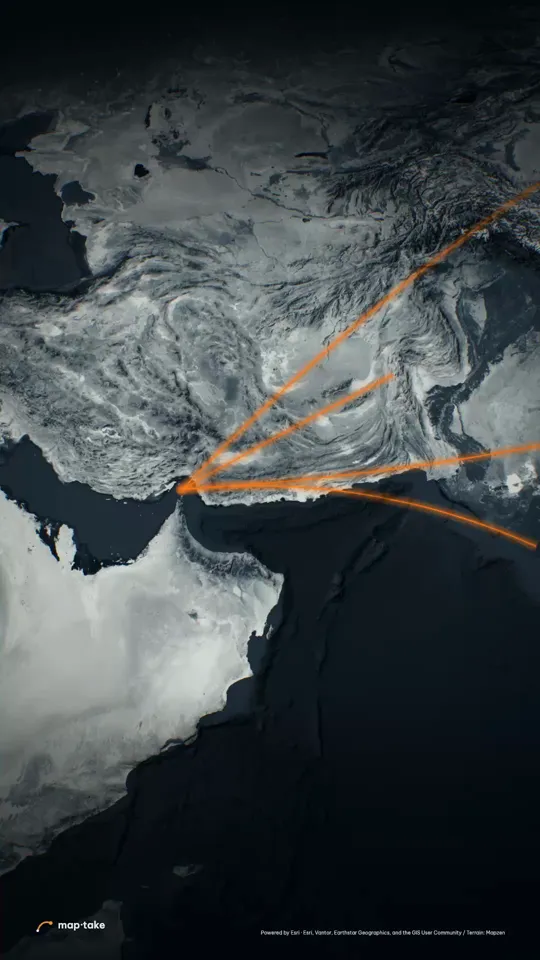 The Strait of Hormuz Explainer · 9:16 · 30 s Tense geopolitics in cold steel: one glowing line on a dark globe.
These are history and news examples. No sample yet shows a modern front line, so treat the table below as what the editor can do, not as something already shown.
What are the parts of a war map, and how do I make each in Maptake?
A war map is five or six parts. Each one is a layer on the timeline that you can edit.
| Element | How you make it in Maptake |
|---|---|
| Territory | An area from built-in data: search a country, region or city and add its boundary. Or import your own GeoJSON with “Feature”, then “Import a file”, in the Add dock. |
| Front line | A cut shape on the area: a half-plane, circle or polygon that subtracts from it or intersects it. Keyframe it so the edge sweeps. The edge can be hard, jagged or soft. |
| Attack arrows | A spline route with an arrow as its moving head, drawn on by animating “Trim end”. |
| Units | A truck, helicopter, plane or ship, or your own icon or .glb model, riding a route and turning along it. |
| Dates and labels | Typed text on a label or a card, timed to the moment. You can fix a date by retyping it. |
| Look | Phosphor (war room), Front Page (newspaper), Old Atlas or Cold Steel: each is a ready-made project to open and reuse. |
How should the camera move on a war map?
A slow push builds tension, a fast slam hits the strike, and a hold lets the date land.
The Rome score shows it. From 0 to 5 s the camera glides slowly over central Italy with one line already leaving the city. At 5 s it slams out to the western Mediterranean in 0.7 s. From 5.7 to 14 s it drifts east while the lines march out one at a time, about 2.5 s each. From 14 to 20 s it pulls back to the whole Mediterranean as the last line lands, and the year “117 AD” appears at about 16.5 s. From 20 to 22 s the camera barely moves, which gives the date time to land.
From 22 to 26 s a slow turn runs while the lines retract toward Rome, one by one. The watch page has the full score.
How do I fine-tune a war map animation by hand?
Open the project and work on the timeline. To build one from nothing, without the agent, follow these steps:
- Choose a look. Pick a basemap preset, or open one of the example projects (Phosphor, Front Page or Old Atlas) and replace its content.
- Add the territory. Search for a country, region or city (“Search places, regions, countries or coordinates…”) and add it as a “Boundary”. For historical borders, import a GeoJSON with “Feature”, then “Import a file”, in the Add dock.
- Animate the front line. Add “Cut shapes” to the area, then keyframe them: a half-plane or polygon that sweeps across the territory. Choose a hard, jagged or soft edge.
- Add arrows and units. Draw a route as a spline and animate “Trim end” to draw it on. Give it an arrow as the moving head for an attack, or a truck, helicopter, plane or ship for a unit.
- Label dates and places. Add a label for each place and a card or label for each date.
- Set the camera and export. Add camera shots with easing curves, then open “Export video” and choose “One video”.
Open the Rome project in the editor to see how the lines and labels are laid out.
How do I keep a war map accurate?
Put the source and the date on screen, mark what is disputed, and say when a line is illustrative. A war map is a claim, and viewers will check it.
- Show the source and the date. A small credit on screen, and the same in the description.
- Mark disputed borders as disputed, in a label or a different line style, rather than choosing a side silently.
- Say when a line is illustrative. The Hormuz project notes that its ship lines are drawn by hand on water, not from shipping-lane data.
- Use a dated GeoJSON for historical borders. Built-in data shows today’s borders.
The Phosphor look suits D-Day, the Cuban Missile Crisis and how a plan worked. It is not for stories where grief or civilians are the subject, or where a war is still going and the map could mislead.
Questions people ask
- Can AI make a war map animation?
- Yes. Describe the conflict, the period and the length, and the agent plans the story, places the territory, lines and labels and sets the camera shots on the timeline. Then check what it made as you would check any war map: the source and date of every claim, where each border sits and whether disputed ground is marked as disputed. Fix anything off by hand.
- Can I show a front line moving day by day?
- Yes. Put a cut shape on the territory and keyframe it, one keyframe per date, with a date label timed to each. The edge sweeps between keyframes; pick a hard, jagged or soft edge to suit the source.
- Can I use historical borders (WW1, WW2)?
- Upload a GeoJSON of the period. The built-in country and region data is today’s borders, so for 1914 or 1942 you need a dated file from a historical source.
- How do I write a good request for a war map?
- Name the conflict and the period, the length and the frame. Say what the viewer should remember and what the map must show, such as territory, a front line or a route. Give the sources if you have them. The request quoted above is short and still states the question, the length and the mood.
- Can I make it in the style of Johnny Harris or Vox?
- You can build the same ingredients: a dark or paper map look, a slow push for tension and a hard slam on the key moment. Copy the technique, not their footage, and use your own sources and script.
- Can I add my narration?
- Yes. Upload the audio and place it on the timeline. Audio in exports is on Pro and Studio; the free plan exports without audio.
- Is it free?
- You can build and preview on the free plan, which has 100 AI credits a month. Exports are up to 1280 px and 10 seconds, with a watermark, for personal use. A full-length explainer needs Pro, which exports up to 3 minutes.
Build your first front line
Open the editor free, describe your history map to the agent and check the result. The free plan needs no card.
Related
Map data © OpenStreetMap contributors, Natural Earth. Tiles © Protomaps. Satellite imagery: Esri.